![Multifamily Deal Analysis [Step-by-Step]](https://realestateraw.com/wp-content/uploads/2023/08/RER-Blog-Covers-Bill-Ham-23-1024x577.jpg)
“Location, location, location!” We have all heard this tried-and-true real estate adage. Although I do completely agree with the value of a good location, money is made on the spreadsheet. Most people imagine the business of real estate to be traveling around, meeting high-flying sellers, and closing big splashy deals. This does occur, but it only represents about 2 percent of the time you will spend in your business. The other 98 percent will be spent doing things that you may find boring or tedious. I personally don’t like underwriting deals, but I also know that that’s where the cash is. Deal analysis is as much an art as it is a science. Money is made on the spreadsheet.
Here is another oldie but goodie: “You make money when you buy.” Bullshit.
You may create value when you buy an asset, but let’s be clear: You make money when you exit the deal profitably and the check clears the account. Ask anyone who has been through a foreclosure if they made money when they bought it.
Any good deal analysis starts with the exit strategy first. Don’t go in if you don’t know the way out. The reason I hate the comment “you make money when you buy” is because it completely mitigates the value of a profitable exit strategy. I have covered exit strategies fully in other works available in my book and on my website but understand that no analysis is complete without a solid exit strategy as part of it.
Note-
This article is not about using creative financing for multifamily, but the income approach is a critical aspect of analyzing a deal when considering the master lease option or seller financing for multifamily. Here are a few more articles that reference this info.
- How to find master lease deals
- How do you structure a seller financing deal
- Multifamily due diligence
- What is a fair interest rate for seller financing?
The typical methods for valuing a real estate asset are the income approach, the comparable sales approach, and the replacement cost approach. Here is a brief description of each:
- Income approach
- Value a deal based on how much revenue it produces.
- Value = Net operating income / Capitalization rate
- The more revenue the asset produces, the higher the value.
- Comparable sales approach
- Use the sales price of similar assets to ascertain the value of the subject property.
- This is usually measured in price per square foot or by price per rental unit.
- Cost (replacement) approach
- The cost approach is the process of valuing an asset by considering what it would cost to replace the subject building with a new one. Land value and depreciation are subtracted from the cost of the new building to arrive at the value of the present asset.
As real estate entrepreneurs, we will most often use the income approach and the comparable sales approach. The cost approach is used by appraisers and lenders more than private investors. In this chapter, I will focus on income and comparable sales approaches to valuing a deal. Then I will discuss valuing a property by its physical condition and location.
Income Approach
The basic idea behind the income approach is to answer the question “If I pay what the seller wants for this property, will it cash flow enough?” The more you pay the seller for the property, the less it will produce in profits to you. How do you determine what is enough cash flow? The answer begins with the question, what is your cost of capital? Put more simply, what does your money cost?
Money is a tradable commodity like any other. It is bought and sold every day. You need money to buy real estate. Do you have all the money you need to buy all the real estate you want to buy? If the answer is no, then you will need to buy some money to buy some real estate. What is the cost of the money you are going to buy?
In most deals, the money to purchase the asset will come in two forms: the money from the lender and the down payment money. The cost of capital on the lender’s money is easy to understand. It’s simply the interest rate on the borrowed money. The cost of capital for the down payment is different depending on whose money it is.
If it is your money, then you simply need to decide if the projected cash flow is enough for you. If the down payment is coming from investors, then you need to know what return on investment (ROI) would be satisfactory to them. Now calculate the total cash flow of the deal. If it is above your cost of capital, then it will produce enough income to service your investor’s needs.
To begin a financial analysis of an asset, we start with financials for the property’s operations, or a P&L statement (profit and loss in a 12-month format). We use the term trailing because a T12 should go back twelve months from the most recent month regardless of the fiscal year. See appendix B for an example of a full T12.
This information will ultimately come from the seller or the seller’s management but will likely be given to you by the real estate agent. Going directly to the realtor’s website and downloading the information is also a good way to get what you need (T12, rent roll, offering memorandum). Once you have the current financial information, you are ready to start underwriting the deal. I suggest that you do not accept financial or tenant data more than ninety days old. The basic math formula to any real estate deal is simple:
Income – Expenses = Net operating income
Net operating income – Debt service (mortgage payment) = Cash flow
Cash flow / Total dollars invested = Cash-on-cash return (CoC)
Assume that a deal is financed with a traditional debt structure of 80 percent loan to value (LTV). You will borrow 80 percent of the price from the lender, and you will bring 20 percent cash to the deal (plus any closing costs). What is the interest rate on the loan, and what is the ROI that you need to get on the down payment? These two numbers blended will give you the total cost of your capital. If you own the down payment money, then you just need to decide what ROI is worth doing the deal. The CoC return will be the ROI on your down payment.
If you plan to raise private capital for the deal (syndication), then you must know what level of return your investors want to get. In the sixteen years that I have been in this business, I have found that most private investors want about an 8 percent CoC return and an internal rate of return (IRR) of about 15 to 20 percent. This is just from my experience, but private investors like to double their money about every five years.
Once you have completed entering the income and expenses in the analyzer template with the financial data, you will be looking at the returns created by the deal. You will be deciding if the asking price will give you an ROI that is acceptable. If the price does not work, then what price does? The main information that you will need to get from the financial analysis is summarized in these metrics:
- CoC return
- Cap rate
- DSCR
- IRR
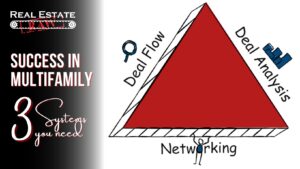
Through networking, you will find out what returns private investors want. Once you ascertain this information, the rest is a function of the formulas already mentioned. If, per your analysis, a deal produces enough CoC, then it is worth taking it to the next level. Meet the realtor and tour the asset.
A good deal analysis template will allow you to enter the purchase price, income, expenses, and mortgage information. Once this data (from the T12) is entered into the template, it will calculate the values for cap rates, CoC, and IRR. Each deal will be different, and what number will work will also be decided by the structuring of the deal. More on this in chapter 10.
Cash-on-Cash Return
This is the ROI created by the net positive cash flow from the deal. When calculating this return, keep in mind that it is cash flow divided by all capital brought to the deal at closing. This includes the down payment, closing costs, and any money that you are adding to the deal for renovations—all cash brought to the deal. If you are bringing on investors, you will want this number to be able to pay them any annual returns promised from income. Profit at sale is not included here, just cash flow.
Capitalization Rate
In basic terms, the cap rate is a quick way to compare the price with income ratio from one property to another, and it is expressed in a percentage. Cap rate is calculated by dividing the net operating income (NOI) of a property by its sales price (or market value). The way that cap rate is used in day-to-day valuation is by comparing the cap rate of an individual property with the cap rates paid by other buyers in the market on similar assets.
Capitalization rate = Net operating income / Price
Price = Net operating income / Capitalization rate
One thing to keep in mind when dealing with cap rates is that they are an inverse ratio. The lower the cap rate, the more expensive (and presumably valuable) the deal is. This type of asset will typically go up in value more but cash flow less than assets with a higher cap rate. Assets with higher cap rates tend to cash flow more but appreciate less. Cap rate is just a way of seeing how much other people are willing to pay for a source of income in the market.
If buyers in your market are paying a 7 percent cap rate on a certain type of asset and you find a similar deal that you can buy at a 10 percent cap rate, is this good or bad? Ignoring all other factors, this would be a good deal. If everyone else is paying a 7 percent cap and you get it for a 10 percent cap, then you can resell it instantly at 7 percent and make a profit. The reverse can be true too. If everyone is paying a 10 percent cap and you are paying a 7 percent cap, then you are paying more than everyone else in the market.
The cap rate I have used here is a bit extreme, but it is an example only. In reality, cap rates tend to be closer in spread than 7 to 10 percent. Cap rates also vary by asset type, class, age, location, and the swing of the economy in general.
Debt Service Coverage Ratio
DSCR is most important to our lenders, but it is equally important to us as buyers. DSCR is the total annual debt service (mortgage payment) divided by the NOI. What this shows our lenders is how financially healthy this asset is or isn’t.
Debt service coverage ratio = Net operating income / Loan principal + Interest
A DSCR of 1.0 means that for every dollar that you create in NOI, you have one matching dollar in debt. The deal does not cash flow. If you are less than 1.0, the asset’s NOI will not cover the mortgage payment, and you would need to add money every month to cover that payment. A DSCR above 1.0 means that the deal will cash flow. Most lenders want to see assets that have a DSCR of 1.2 or higher.
If your asset is below 1.2, then the lender may consider this a riskier deal and will likely raise your interest rate or lower the loan amount (or both). Below the 1.2 mark, your lender will likely consider this a distressed asset. This is an important point to consider when analyzing a deal as estimating the loan criteria for the analysis is crucial. If you think you are getting an 80 percent LTV but find out after you make an offer that you can get only 65 percent LTV (low DSCR), you will have to renegotiate the price or what is called a re-trade in the real estate business. Sometimes great deals have low DSCR if they need heavy renovations or have high vacancy, but that is a distressed asset model. More on that in chapter 14.
Using DSCR can give you a good starting point to negotiate a sale price with a seller. If the seller’s asking price and NOI calculate a DSCR less than 1.2, you should use this to argue a lower price. If the DSCR is less than the acceptable level, you can do only one thing: borrow less money. To borrow less money, you will need to lower either the price or the LTV. If you lower the LTV, you will be making a larger down payment that in turn will lower the CoC return. I suggest that you lower your offer price and explain to the seller or realtor why you are doing that, noting that the low DSCR created by the seller’s asking price is not an issue unique to you. All buyers will have the same problem when they apply for their loans; therefore, the seller should just accept your offer now and be done with it.
Internal Rate of Return
A true IRR can be difficult to calculate for a real estate investment. It takes depreciation and other accounting techniques to calculate. A good deal analyzer template should handle the calculation for you once the applicable information is entered. For a more detailed explanation of IRR, go to www.investopedia.com/terms/i/irr.asp.
Annualized Return
To calculate annualized return, we must calculate the total ROI produced by an asset.
Total return on investment = (Cash flow + Profit from sale + Principal paydown) / Cash investment
The total ROI is all the cash flow plus all the profit from the sale divided by the total amount invested in the deal. The profit at sale consists of appreciation (sale price minus purchase price) plus how much you have paid the mortgage down during the time you held the asset (principal paydown). To calculate the annualized return, you simply divide the total ROI by the years that you owned the asset.
Annualized return = Total return on investment / Years held
If an investor wants to double their money every five years, that is an annualized return of 20 percent: 20 × 5 = 100. The math is technically important but not as much as the application of the concept. If total profits include cash flow and appreciation, then we can analyze a deal to determine whether one may outperform another for this asset. If it does not cash flow much, it had better go up in value. If it is not going to go up much in value, you need high cash flow. Both scenarios can produce the same annualized return.
An apartment complex with low occupancy is a good example of this. You may find that an asset is underperforming and needs to be renovated (value-add). This deal is likely to be negative on cash flow and may even be negative on the operations in general until you reach a breakeven point (see chapter 14).
The complex may not be cash flow positive for a while, but what if it doubles in value the day you reach a stabilized occupancy? Would that be a good deal? Probably. What if it took only twelve months to renovate and stabilize the property? Would it be good to double the value of your asset in twelve months? Definitely. You would greatly exceed the timeline of five years to double your value, and none of the profit came from cash flow. This is how a renovation project typically works. No cash flow but huge returns on the sale or refinance.
The opposite could be possible as well. If you have a building that is in bad shape or in a bad area, or if you are in a depression cycle in the economy, you may not have much appreciation. If this is the case, buy the property for a low enough price that would allow you to cash flow enough to create acceptable returns. In almost all situations, you will have some cash flow and some appreciation. One of the arts to this business is the ability to know how to blend the two just right to maximize profits.
Cash versus Accrual
There are a few terms I want to cover before moving forward.
Gross potential rent: This is the maximum amount of rent a property could produce if fully occupied, at full market rent, 100 percent of the year.
Market rent: This is the average rent collected by comparable properties or units in the immediate area. This is what you could collect in rent.
Effective rent: This is what the unit is actually rented for today.
Loss to lease: This is the difference between effective rent and market rent when the market rent is higher than the effective rent.
Gain to lease: This occurs when effective rent is higher than market rent.
Gross effective rent: This is the gross potential rent adjusted for loss to lease and vacancy.
Bad debt write-offs/uncollectable: In an accrual system, this is money that was charged to tenants (accrued) but was never collected. It must now be subtracted from the income as a loss.
Concessions: This is anything that is given away to get a renter to rent the unit. This is most often free rent but could also be other items of value, such as a TV, or a free service, such as cable or internet. This will be recorded on the T12 in a dollar amount.
Physical occupancy: This is how many units have someone living in them.
Economic occupancy: This is how many units have someone living in them and paying rent. The unit is considered physically occupied and economically vacant if someone is there and not paying.
One crucial aspect of analyzing a property’s financials or P&L is to note whether the accounting method used to create the books is cash or accrual. Cash and accrual accounting are both methods of accounting that are associated with generally accepted accounting principles. Let me explain why this is relevant. Note that you don’t have to know how to use cash or accrual; you just need to be able to recognize the difference when looking at a T12.
Figures 2 and 3 are sample sections of two income statements. One is cash accounting, and one is accrual. Simply put, an operator keeping cashbooks for a property would record money only if it was actually collected and record nothing if it wasn’t. If an operator is using the accrual method, then they will record what is due at the first of the month (rent) and subtract from that number whatever was not collected (vacancy).
Figure 2
Figure 3
Most accrual books start with gross potential rent or market rent. From there, loss to lease, vacancy, concessions, and write-offs are all subtracted. Other income is added to the total to arrive at the effective rent. This is essentially the cash collections for this property.
Note: In due diligence, you would ask for twelve months’ worth of bank statements from the seller. You would be reconciling or matching the monthly effective income amount to the corresponding monthly cash balance in the bank. They should match.
The point in showing you the difference between cash and accrual formats for bookkeeping is so that you don’t incorrectly analyze the deal by over accounting for vacancy. The problem comes when you get used to looking at accrual books kept by professional owners, and you get cashbooks kept by a less sophisticated owner.
When looking at cashbooks, the most common mistake is to think that the seller has omitted vacancy for some reason. You then take the income from their cashbooks and subtract vacancy. See the issue? Vacancy is already accounted for by keeping the books in cash basis to begin with. If the seller didn’t collect the rent, it is never recorded in the first place. Vacancy is included. If you assume a vacancy rate (10 percent, for example), you would be adding extra vacancy where it didn’t exist. This may make a good deal look bad. Always know whether you are analyzing a cash, or an accrual set of books.
The income approach is the main technique for analyzing deals, but it is not the only one. My very first real estate mistake came from my very first deal—a duplex in Macon, Georgia, in midsummer 2005. The mistake was not that I used the income approach to analyze the deal but that I used only the income approach to analyze the deal. The purchase price and loan I was able to get allowed me to cash flow what I thought was enough. The mistake I made was using only the income approach and not placing the deal in the context of the surrounding area using comparable sales data. I overpaid twice the amount. The income approach is the financial way to analyze a deal, but there is much more to consider.
Comparable Sales Approach
What is everyone else paying? This is the basic concept behind the comparable sales approach to valuing a deal. This method uses recent sales of like kind assets to determine the value of the subject property. Looking up comparable sales data is easy; it’s knowing what to look for and what you are looking at that matters. Sellers and real estate agents are masters of presenting data to highlight a property they have for sale. The value is most often not in what you are told but in what you are not. Here are the four main areas of concern when determining comparable values.
Asset Class
Commercial and multifamily properties are classified into four categories: A, B, C, and D.
- A class property
- Less than ten years old
- Excellent condition
- Modern amenities
- High-income area
- B class property
- Ten to twenty-five years old
- Good shape
- Slightly outdated amenities
- Mid- to high-income area
- C class property
- Twenty-five to fifty years old
- Affordable housing
- Aging assets
- Older amenities to no amenities
- D class property
- More than fifty years old
- Highly distressed asset
- High crime area
This description of real estate is just a rule of thumb, but it is generally accurate. A variation of the rule would be an old building that has been renovated or repurposed. Many old factories and warehouses have been converted into luxury apartments and condominiums. Technically speaking, these buildings are quite old, but because of the renovations, they will have a cap rate comparable with a newer building. When analyzing a deal, make sure to accurately compare the asset class in general.
Size (Number of Units, Price per Square Foot)
When comparing real estate assets, make sure that their comps are close in size. Larger assets trade at different values than smaller ones. Price per square foot is used to determine comparable sales as well as price per unit. To calculate this, take the total viable square footage (living space in apartments) or number of units and divide by the purchase price.
When dealing with commercial real estate assets, the comparable properties should not be more than 20 percent larger or smaller than the subject property. In apartments, for example, if the subject is a 100-unit deal, then the comp properties should be between 80 and 120 units.
Age
The date of construction should be within ten years of the subject property. Older buildings will not command the same rents as newer ones. I will cover this fully in chapter 14.
Amenities
Make sure that the comparable properties have similar amenities. New and more attractive amenities will bring higher rent. Each asset type—apartments, office, storage—will have its own amenities package. Look for things such as a pool, fitness/business center, green space/dog area, and so on.
At this point in the analysis process, you will create a pro forma for your deal. A pro forma is a financial projection of the future of your business or asset. It is a business plan. If the property is stabilized and cash flowing presently, then your pro forma is less crucial. But if you are renovating or stabilizing the operations of an asset, the project’s success will be based on your ability to create an accurate pro forma. This is such a critical topic that it has its own chapter (see chapter 7).
The (Replacement) Cost Approach
This method is the least used by the average investor in commercial real estate. I mention it here because it’s an important concept to understand but not one you’ll use in everyday analysis. The cost approach determines the value of a property by summing the land value and the depreciated value of any improvements.
The basic concept adds up all the costs of replacing existing buildings with brand-new ones (replacement cost). Now subtract the depreciated value of the old buildings from the replacement cost using comparable data from the market. This valuation technique is most often used by appraisers and is combined with the income and comparison sale approaches to create an average value.
The No-Income Approach
This is not a real term in real estate, but it can be a real situation. What if a deal has low or no income to analyze? This is a common problem when analyzing a heavy renovation project that may have little occupancy or income. If we use the standard income approach, you will get an extremely low valuation, if any at all. Even though this is mathematically correct, it is unlikely that the seller will sell the property at zero dollars or close to it.
We must reverse engineer the valuation, starting from what the property would be worth once it’s fully renovated and occupied. To get this value, calculate a projected NOI representing the property fully occupied and at market rent (consider vacancy in this number). Now take the projected NOI and calculate the value of the asset using the market cap rate for similar properties. For example, a property that has a comparable cap rate of 7 percent in the market and an NOI of $100,000 would have a value of $1,428,571.
Price = Net operating income / Capitalization rate, or in this case, $100,000 / 0.07 = $1,428,571
Note: Remember that cap rates are percentages. A single-digit cap rate such as 7 percent will be represented mathematically as 0.07.
Now that you know what the asset will be worth once it’s fixed up (after repair value or ARV), what is it worth today in its present condition? The answer is mathematical and personal. I will show you how to calculate the value, but you will have to decide if the work and the risk are ultimately worth the effort. This is a return on effort. As for the math, begin by calculating the breakeven ratio.
Breakeven ratio = Total operating costs + Debt service / Potential income
The idea here is to figure out what occupancy the property must be at to break even with all the property’s expenses. Next you must figure out your absorption rate. This is the number of renovated units you can lease per month. There is no formula for this as it will be different from market to market and from property to property. Contact a local management company to help you determine the absorption rate. In my experience, an absorption rate of ten units a month is average.
Now that you know how much money it will take you to fix the place up and how long it will take to break even, add in the amount of money you will need to carry the operations of the property until you reach the breakeven point. All these costs added together will be the cost basis for the project. Is it worth it? That’s the part that only you will be able to answer—the return on effort.
I suggest that you make enough money for it to be worth the trouble. Doing a large renovation project can take you out of the market for a while. This is an opportunity cost that may cause you to pass on future projects until this one is complete. This type of project can be expensive and time consuming, but it can also bring great educational benefits. Never forget the value of experience as it is worth more than the money it produces.
Analyzing the Rent Roll
The rent roll is often underused when it comes to deal analysis. A rent roll is the tenant ledger that shows all residents at a property and some basic details about their leasing information. The rent roll should provide you with the following items:
- Tenant name and unit number that they occupy
- Lease start date
- Lease end date
- Lease amount (rent due)
- Deposits on hand for each renter
- Unit floor plan and unit size in square feet
- Tenant balance
Rent rolls may have more information than this, but they should have these basic points at the very least. The rent roll is a key aspect of the analysis process in several ways. The tenant balance information is the most important. The rent roll should have a tenant balance column on it, usually to the far-right side of a rent roll. This shows how much each tenant owes in current and back rent. If the tenant has prepaid rent, it will show that here as well.
It is my experience as a rental operator that if a tenant gets two months or more behind in rent, they tend not to catch up. This usually results in the resident skipping out on the rent and the apartment or the landlord going through the eviction process. The key is to see what the monthly rent is for each unit and to note any unit that has a balance of twice the current rent. This is an economically vacant unit.
The rent roll is crucial to creating the pro forma as well. A pro forma is a financial projection for the next few years of operations at the asset you are analyzing. This will be covered in full in chapter 7. The rent roll is also used to create the gross potential rent and to calculate vacancy if the seller is keeping the T12 in cash basis. Take all the units, add up the total market rent, and multiply by twelve. This would give you the gross potential rent if the asset was 100 percent occupied at market rent. If you wanted to know the historic vacancy on a cash T12, you would take the gross potential rent for a given month and note the difference between the projected rent (from the rent roll) and the amount of income on the T12. The difference would be the vacancy.
Mindset: Cash Flow Misconceptions
Cash flow is mostly a bullshit concept. I know this comment is real estate blasphemy, but before you throw this book in the fireplace, let me explain. I have already noted that cash flow is produced from equity. If you have a cash flow goal, you really have an equity goal. No equity, no cash flow.
Cash flow will get you out of a job, but it takes equity to stay out of that job. You’ve heard the old real estate adage of “location, location, location,” but no one ever says, “Cash flow, cash flow, cash flow.” This is because location creates appreciation. Appreciation of equity is not only the way to gain real wealth but also the way to keep it.
You must have and create cash flow, or you will not survive in the real estate business. Cash flow is king. It keeps the lights turned on and allows you to run your business, but no one is getting rich on cash flow.
For more information no deal analysis for multifamily properties, check out my site www.realestateraw.com.
Best of luck!
Bill Ham